Bitcoin Monthly View: Price Action Still Bullish
There was a saying that got drilled into my head when I first started day trading full time...
- Larger timeframes dominate
And it is true, that is what mantras like "the trend is your friend" exist and work.
Thus I always take a look at the monthly chart when trying to chart a course for bitcoin price.
As of now, I'm still feeling positive on what I see. That can easily change with one swooping move in price though.
To the chart!
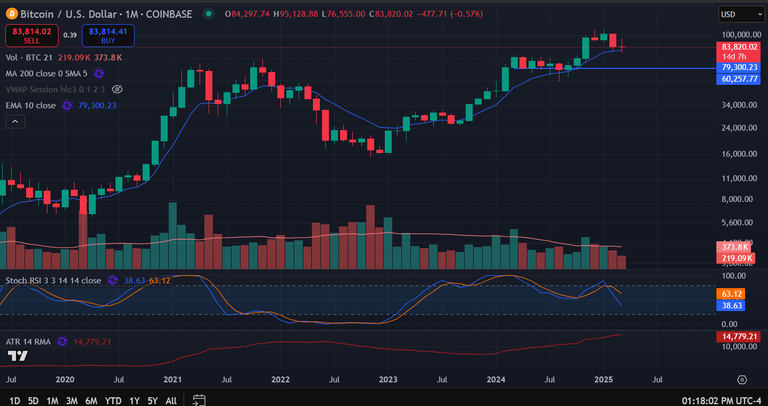
Looking at this monthly chart you will see the blue moving average line. That represents the 10 period moving average. I like this moving average as it has seemed to always act as a good overbought/oversold gauge along with trend confirmer.
As you can see many times price runs up and then sees profit taking back to the 10 period average.
Many times it then continues higher, except for when it fails to hold this average. The we often see a longer period of consolidation and even further downside.
As you can see price is testing that moving average now. Ideally we see this month's candle close above it. We can trade down below it (which is another reason 72K is still in play) as long as price still rallies to close above it.
This would keep price action in a bullish tone. If we see price close the month below, then things become more of a coin flip. Atleast that is my opinion.
Posted Using INLEO