Is Altseason Finally Coming? Let us Analyze TOTAL3 and Find Out
Hello everyone,
How are you all? I hope everyone is fine and waiting for the Alt season for last few months or I think years.
To understand when the ALT season might actually begin, today we will be analyzing the Total 3 market cap. The Total 3 market cap represents the combined market cap of all cryptocurrencies excluding Bitcoin and Ethereum which is currently equal to 856 billion dollars at the moment.
In the screenshot below we have shared a 1D timeframe chart for Total3. Watch it closely and we are going to talk about it below.
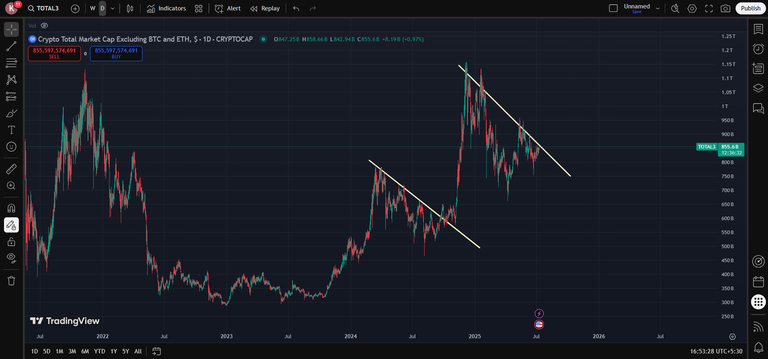
The lower resistance trendline which you see is from last year when we witnessed a massive pump in Alt coins in the march. It was a 143% gain in the Total3 since October 2023 to March 2024 and out of this around 83% was gained from January itself. People still expected further gains and kept holding their ALTS.
Now when that resistance was broken we witnessed a 90% pump in the ALT market cap or TOTAL3 as you can see below.
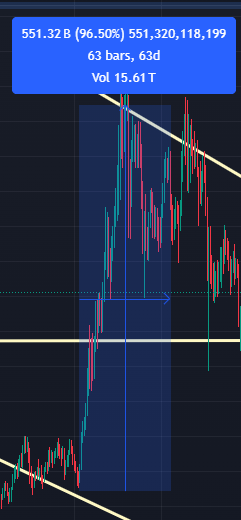
This was the time of November and if you remember well. We almost saw the peak values for our portfolio during that time but we all still kept holding on our tokens in a hope of big ALT season like the ones we use to see in the previous cycles. We ignored about how the market has got mature.
Anyways, now let us look at the current resistance trendline which is actually very similar to the first one. Have a look at it below and then we will talk about it.
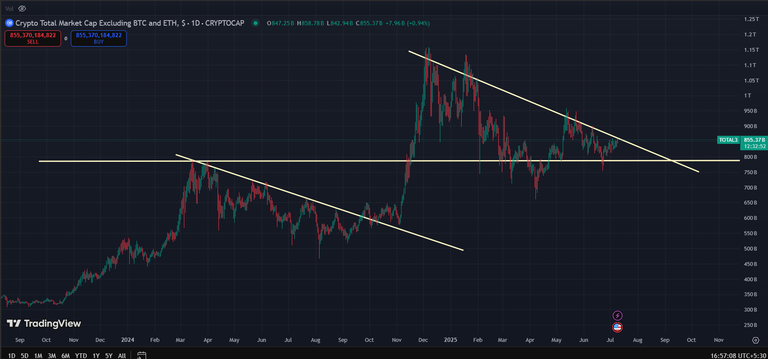
We are at the verge of getting that resistance broken for TOTAL3 but that is not going to be enough. If we see in the chart above we have broken it before as well but we still got a reversal and came down to that straight trendline which was acting as support for TOTAL3. This is the same level that TOTAL3 tested last year in March.
So how can we understand if the breakout of this resistance line will actually act as the last time. We can do that, at least try it but first have a look at the chart below with more short time spans trendline.
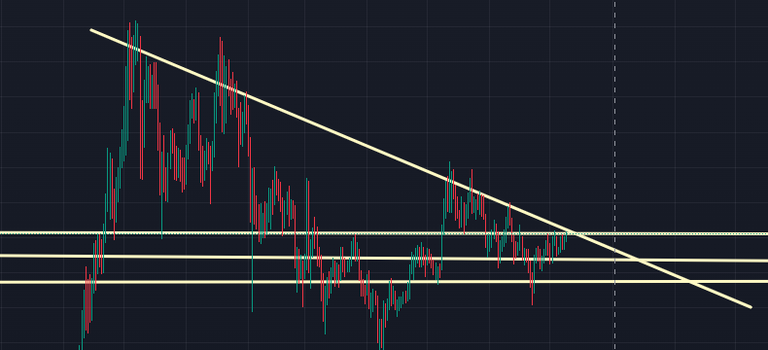
These are the small corrections that are still possible to happen with TOTAL3 as we are below that resistance line. Even if the last straight trendline is broken I predict to not stay at those levels for longer time as it is actually a strong support already and to break it towards the downside we need a strong negative news.
Lets hope no bad news will come now and we only go up for next few months. Now coming back to the main Question again. How will we actually understand if the breakout of that resistance will result in to a big pump in ALT coins even if we witnessed it and the answer to this is there in third screenshot.
In the third screenshot shared in this blog, you can see that we have broken the first resistance and successfully consolidated above that for a good duration of time. If we see good consolidation above the current resistance trendline we can actually saw a big pump in the market in coming weeks or months.
That is what I can understand from analyzing the TOTAL3 market cap based on a little knowledge I have about the charts. What are your thoughts on this? Let us talk about it in comments below.
Thank You and make sure to check Crypto Company services as I recently shared in my blog. You can simply click on the picture below and it will take you to their official website.

This post has been manually curated by @bhattg from Indiaunited community. Join us on our Discord Server.
Do you know that you can earn a passive income by delegating to @indiaunited. We share more than 100 % of the curation rewards with the delegators in the form of IUC tokens. HP delegators and IUC token holders also get upto 20% additional vote weight.
Here are some handy links for delegations: 100HP, 250HP, 500HP, 1000HP.
100% of the rewards from this comment goes to the curator for their manual curation efforts. Please encourage the curator @bhattg by upvoting this comment and support the community by voting the posts made by @indiaunited.
[@PowerPaul:]
Hey buddy. Greetings! Because of your participation in the CryptoCompany community you received a vote from @CryptoCompany and its trail! Thank you for your participation in the "Banner for Boost" campaign.
Hive a great day!