🐝 Hive Price Update 0.342$ 📈
Hello everyone,
I wanted to share an update on the current state of Hive. 🚀
Source:
Graph data source 👉 binance.com "
Fear & index data source 👉 alternative.me
hive other data source 👉 coingecko.com
Data
🥇rank: 369
📈 Cap: 159882111 usd
📊Vol: 6681852 usd
24H 3.47649%🟢
7D 8.0134%🟢
30D -12.88852%🔴
For more information, you can visit the following links:
🔗 Hive
🔗 Hive Explorer
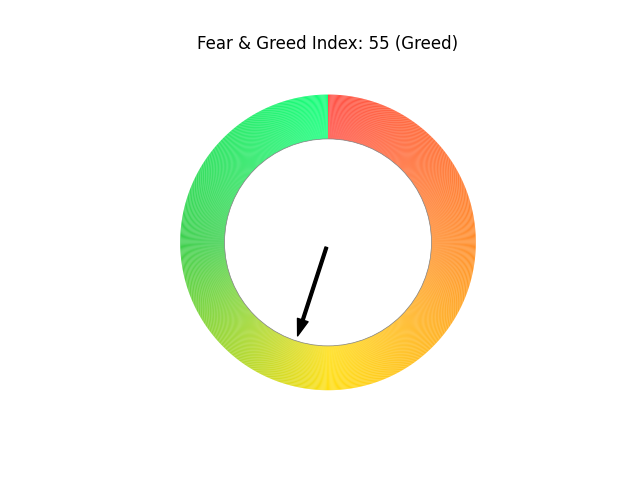
Actual Bitcoin fear & greed index:
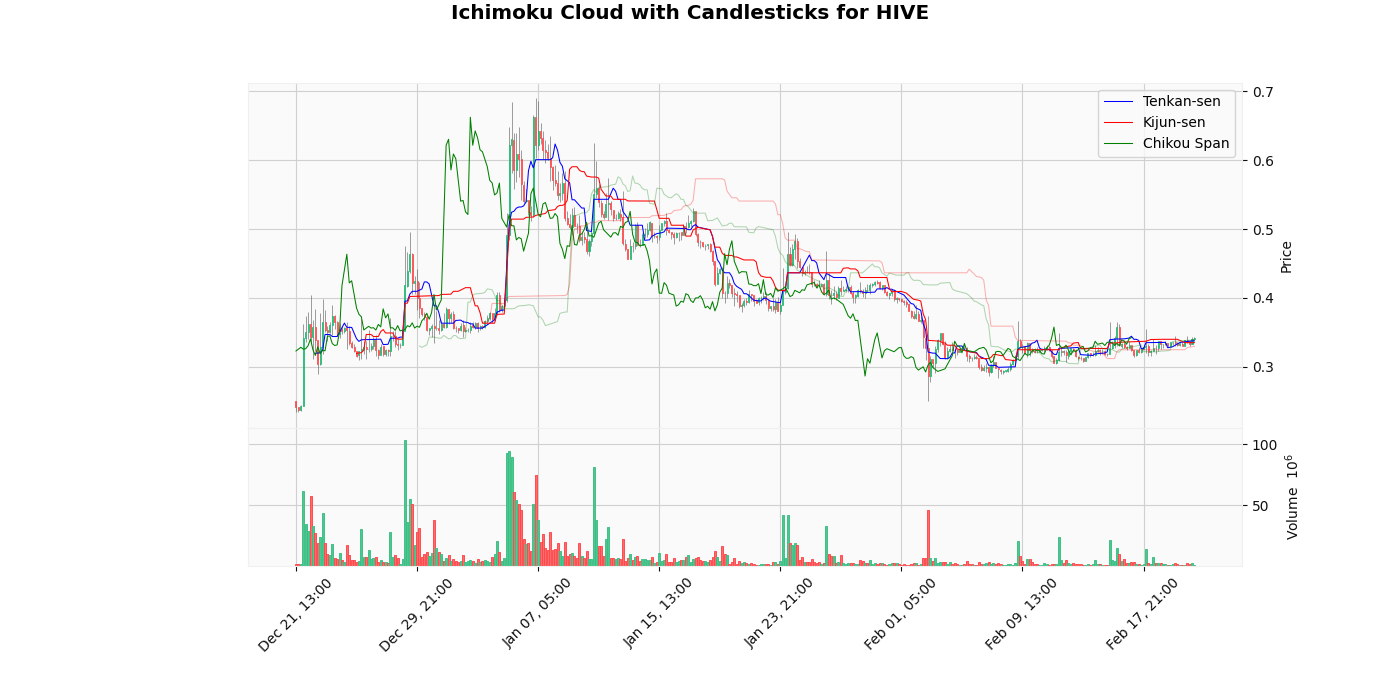
HIVE/USD Market Analysis
- Current Trend: Bullish (Cloud color: 🟢)
- Tenkan-sen: $0.3376 (Price above)
- Kijun-sen: $0.3350 (Price above)
- Support Level: $0.3296
- Resistance Level: $0.3400
- ADX: 64.91 (indicating a strength of trend high)
- RSI: 60.71 (indicate neutral)
- MACD: 0.00, Signal Line: 0.00, Histogram: 0.00
- Volume Strength: -0.73%
Interpretation
The current price of HIVE is located above the level of the Ichimoku cloud, indicating a bullish trend. With a volatility of 70.98%, it is advisable to monitor the price levels around the Tenkan-sen and Kijun-sen to detect signs of strengthening or possible reversal.
Personal Considerations
Bullish Trend
- The HIVE market is showing positive signs, with the current price ($0.3423) above the Kijun-sen ($0.3350). This may suggest a bullish trend, and with the Tenkan-sen supporting further upward movement, we may see an uptrend in the coming days.
- However, with a volatility of 70.98%, it remains important to monitor any sudden retracements.
- The current Ichimoku cloud (Kumo) shows a solid structure, with support in the area of $0.3296.
- For now, the trend seems to be in favor of the bullish, but I will continue to follow closely to see if it will hold above this support.
Conclusions
- Given the current price of $0.3423, if it continues to respect the support level at $0.3296 and the resistance level at $0.3400, the trend could maintain its current direction.
- However, should the price break below the Tenkan-sen ($0.3376) or the Kijun-sen ($0.3350), it could signal potential weakness in the market, leading to a possible bearish phase.
- Conversely, if the price manages to break above the resistance level, it could indicate a strong bullish momentum, prompting further upward movement.
- The ADX value of 64.91 suggests that the current trend is strong, which should be taken into account when making trading decisions.
- The RSI value of 60.71 indicates that the market is neutral, providing additional context for potential reversals.
- The MACD line at 0.00 crossing above the signal line at 0.00 could indicate a bullish signal, while a cross below could suggest bearish momentum.
- Thus, traders should remain vigilant and consider these levels as critical points for potential entry or exit strategies.
- Monitoring the volatility, currently at 70.98%, will also be essential, as increased volatility may lead to rapid price movements and changes in market sentiment.
Link of analisys: Bitcoin-Fear---Greed-Index---Historical-Data
Link of volume analysis: Hive-Volume-Analysis

Congratulations @menny.trx! You have completed the following achievement on the Hive blockchain And have been rewarded with New badge(s)
Your next target is to reach 1750 upvotes.
You can view your badges on your board and compare yourself to others in the Ranking
If you no longer want to receive notifications, reply to this comment with the word
STOP