🐝 Hive Price Update 0.32$ 📈
Hello everyone,
I wanted to share an update on the current state of Hive. 🚀
Source:
Graph data source 👉 binance.com "
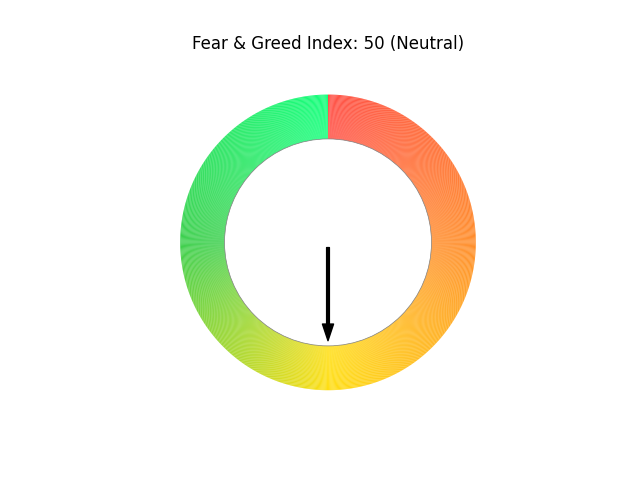
Fear & index data source 👉 alternative.me
hive other data source 👉 coingecko.com
Data
🥇rank: 377
📈 Cap: 149103818 usd
📊Vol: 5161551 usd
24H 0.14174%🟢
7D 9.47217%🟢
30D -35.03559%🔴
For more information, you can visit the following links:
🔗 Hive
🔗 Hive Explorer
Actual Bitcoin fear & greed index:
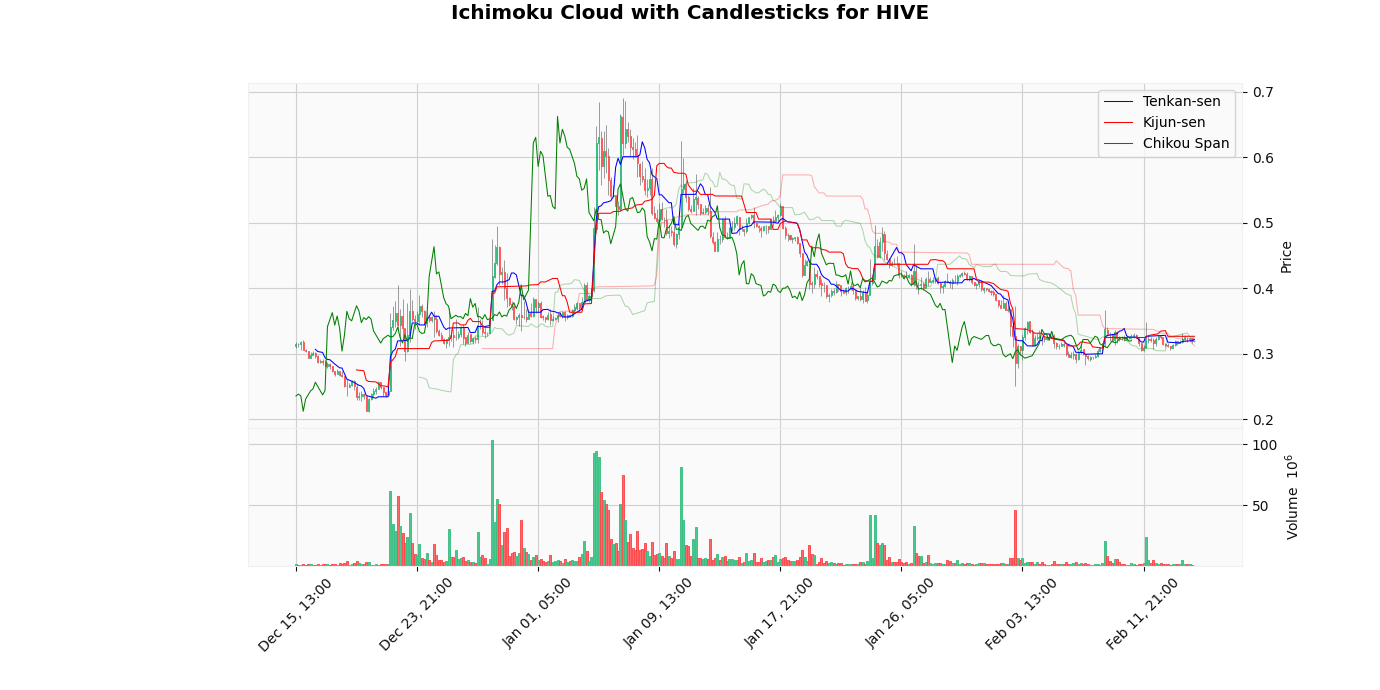
HIVE/USD Market Analysis
- Current Trend: Bullish (Cloud color: 🟢)
- Tenkan-sen: $0.3216 (Price below)
- Kijun-sen: $0.3266 (Price below)
- Support Level: $0.3120
- Resistance Level: $0.3249
- ADX: 10.34 (indicating a strength of trend low)
- RSI: 44.47 (indicate neutral)
- MACD: 0.00, Signal Line: 0.00, Histogram: 0.00
- Volume Strength: 25.71%
Interpretation
The current price of HIVE is located below the level of the Ichimoku cloud, indicating a bullish trend. With a volatility of 72.10%, it is advisable to monitor the price levels around the Tenkan-sen and Kijun-sen to detect signs of strengthening or possible reversal.
Personal Considerations
Bullish Trend
- The HIVE market is showing positive signs, with the current price ($0.3199) above the Kijun-sen ($0.3266). This may suggest a bullish trend, and with the Tenkan-sen supporting further upward movement, we may see an uptrend in the coming days.
- However, with a volatility of 72.10%, it remains important to monitor any sudden retracements.
- The current Ichimoku cloud (Kumo) shows a solid structure, with support in the area of $0.3120.
- For now, the trend seems to be in favor of the bullish, but I will continue to follow closely to see if it will hold above this support.
Conclusions
- Given the current price of $0.3199, if it continues to respect the support level at $0.3120 and the resistance level at $0.3249, the trend could maintain its current direction.
- However, should the price break below the Tenkan-sen ($0.3216) or the Kijun-sen ($0.3266), it could signal potential weakness in the market, leading to a possible bearish phase.
- Conversely, if the price manages to break above the resistance level, it could indicate a strong bullish momentum, prompting further upward movement.
- The ADX value of 10.34 suggests that the current trend is weak, which should be taken into account when making trading decisions.
- The RSI value of 44.47 indicates that the market is neutral, providing additional context for potential reversals.
- The MACD line at 0.00 crossing above the signal line at 0.00 could indicate a bullish signal, while a cross below could suggest bearish momentum.
- Thus, traders should remain vigilant and consider these levels as critical points for potential entry or exit strategies.
- Monitoring the volatility, currently at 72.10%, will also be essential, as increased volatility may lead to rapid price movements and changes in market sentiment.
Link of analisys: Bitcoin-Fear---Greed-Index---Historical-Data
Link of volume analysis: Hive-Volume-Analysis
