Hive Has Bottomed Out ! Hive Coin Analysis !
For the past few days, I have been analyzing the crypto market, and if I say that I'm learning how to analyze, it wouldn't be incorrect. My knowledge is limited, so this is not financial advice in any way. Before investing, you should do your own analysis. In my analysis, there are a few key indicators that I will focus on, such as the RSI (Relative Strength Index), Stochastic Relative Strength Index (StochRSI), and MACD.
These indicators help us understand the direction of the market. I will share different charts with you, which will be from TradingView and GoCharting. I hope this analysis will be helpful for you. Every day, we will analyze one coin, and today, I will start with analyzing Hive.
Here, I want to share something with you all. Whenever we start analyzing the market and want to understand the market's direction, we look at it on a larger time frame. However, if we want to do day trading, swing trading, or scalping, we do it on smaller time frames.

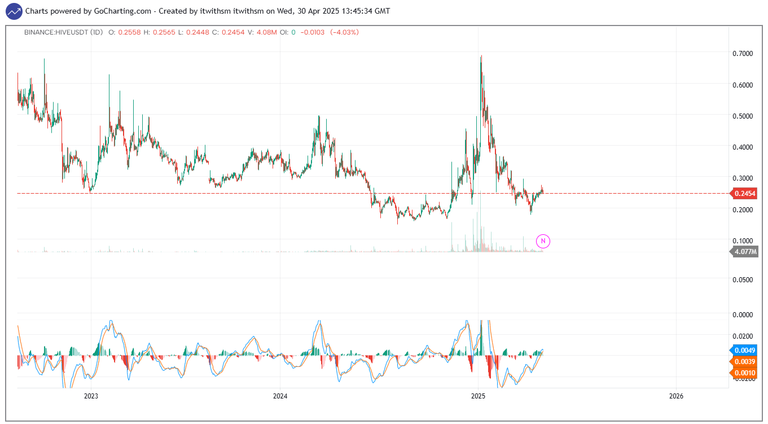
I have drawn a white line on this graph, which clearly shows that Hive has exited its downtrend and entered an uptrend. The white line indicates that Hive has pumped from its strong support zone, and whenever it has pumped from this level, we have seen good momentum and rising prices. This is a 1-week time frame chart. Unfortunately, on the free version of TradingView, we can't open charts for more than 2 weeks. So, to view a 2-week chart, I had to visit another website, which is GoCharting.com.
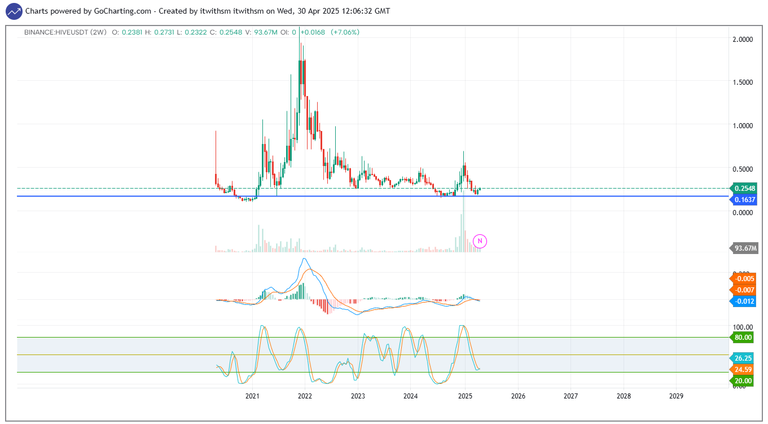
Whenever Hive has pumped from this major support zone, we've seen a strong rally in Hive's price. If you look at the history, the last pump that happened in November of last year saw Hive pump by approximately 305%. This time, the scenario is a bit different. We've all been waiting for an altcoin rally for the past 4 years, and 2025 is the year when the altcoin rally is expected to happen. I see Hive coin increasing 7-10x from here. Even if it doesn't reach that much, a 5x increase is definitely possible. Last year's pump was just a FOMO rally, and in that FOMO rally, Hive pumped 305%, so this time, a 5x expectation, in my opinion, is easily justified. What do you think about this? Please share your thoughts in the comments.
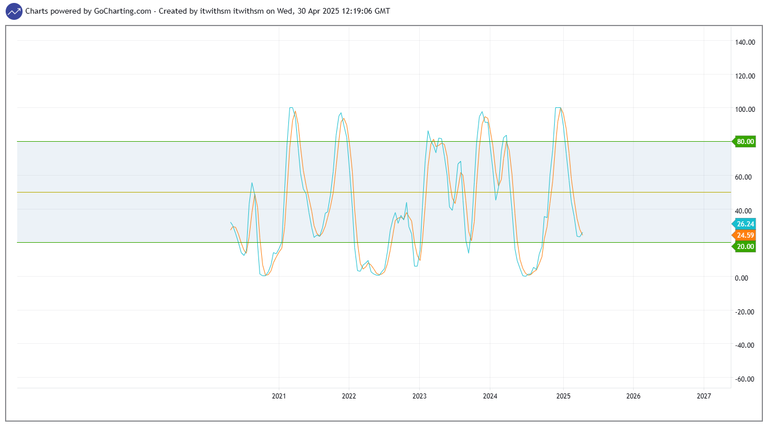
Now, let me tell you why I'm so sure that Hive has bottomed out. The reason is the Stochastic Relative Strength Index (StochRSI), which is a very strong indicator that helps us determine the market's direction. Let me explain a bit about this indicator. You will see two lines on it, one green and one orange. Whenever the green line crosses the orange line and goes above the level of 20, we typically see a pump. Below, I will share a picture of Hive's chart that will confirm this. This indicator is using level 20 as support, and the blue line is crossing the orange line. The picture above is of Hive's 2-week chart.
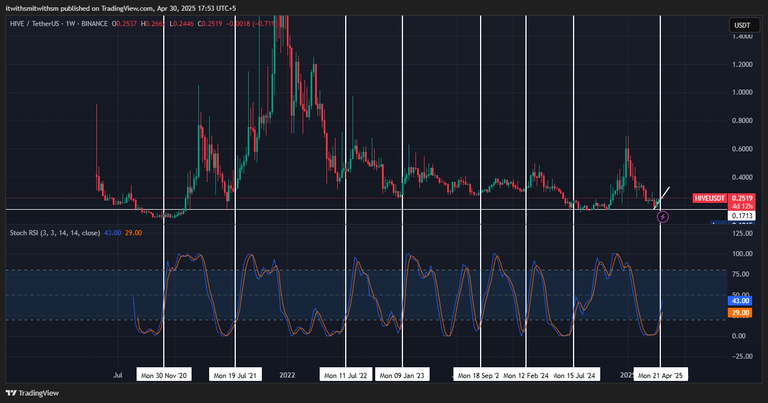
This is Hive's weekly chart, and you can see the white lines. Whenever the Relative Strength Index (StochRSI) has gone above 20, we've observed a significant pump in Hive's price. On the left, there is the rally from December 2020, where this event occurred, and during that time, Hive's price pumped approximately 900% in just 112 days. After that, the 2021 bull run started, and Hive's price pumped nearly 1800%. As you can see, every time this event occurred, Hive's price saw a substantial pump—sometimes 100%, sometimes 200%, and sometimes 300%.
Now, let's look at the MACD.
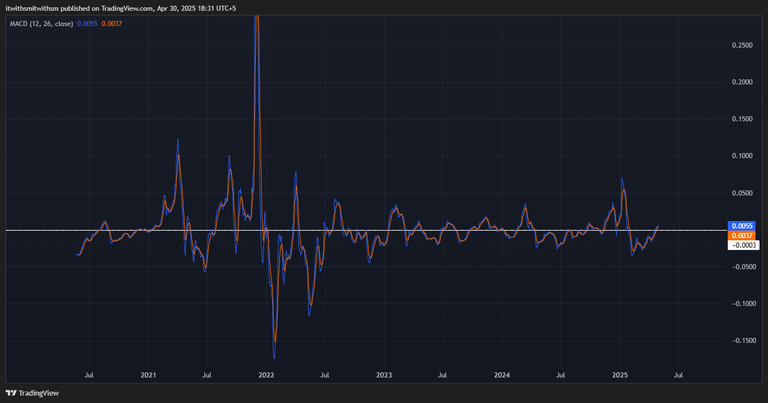
First, let me explain a bit about how the MACD indicator works. On the image, you can see the white line, which is the MACD midline, also known as the zero line. Whenever the blue and orange lines cross above this zero line, we typically see an insane pump.
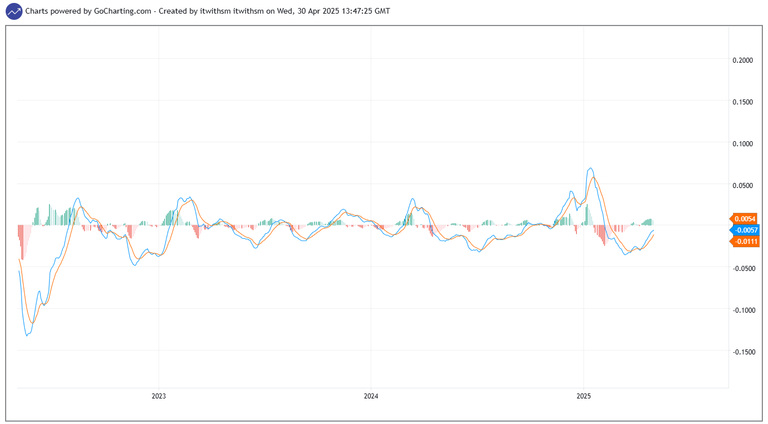
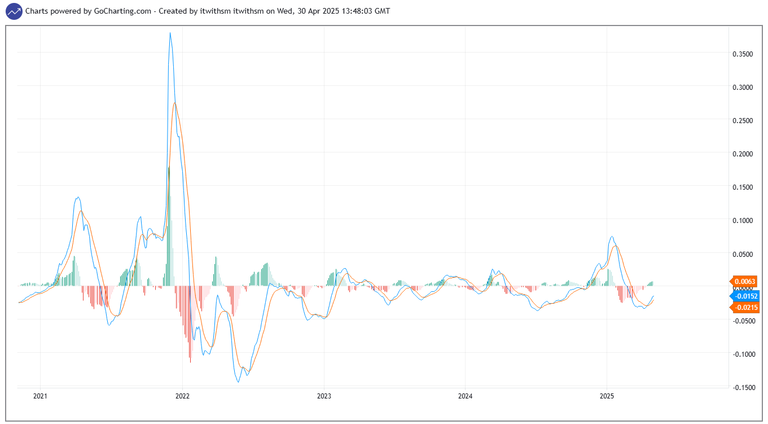
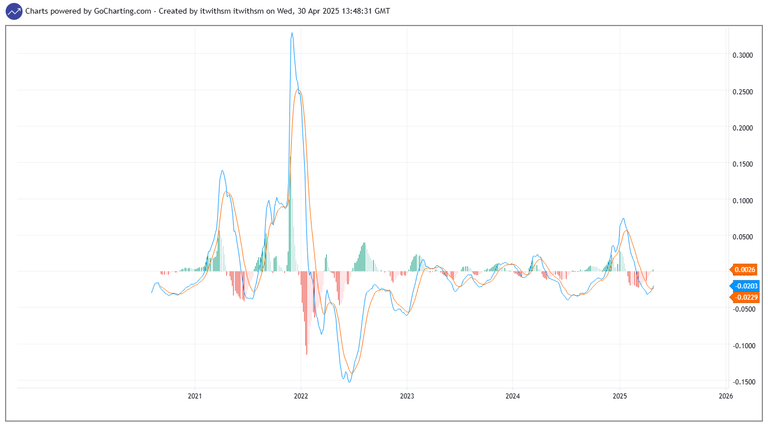
The four images above are from Hive's 1D, 2D, 3D, and 4D MACD charts, where you can clearly see that the trend is shifting. On the 1-day chart, both the blue and orange lines are above the zero line. On the 2D, 3D, and 4D charts, they are below the zero line. But the good news is that the blue line has crossed the orange line and is moving upwards. When both lines cross the zero line, we will likely see a huge pump in Hive's price. As you know, these are longer time frames, so it may take us 8-10 weeks, or even longer or shorter, for this to happen.
It's not a Financial Advice,
DYOR before investing.
Regards.
Itwithsm.
Posted Using INLEO
Nice charts! 📈 Interesting to see the RSI and MACD being used. Keep sharing your insights! 👍
I am glad you liked the charts.